
Historical Immigration
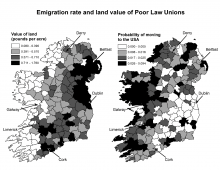
Emma Lazarus’ poem on the pedestal of the Statue of Liberty reads: “give me your tired, your poor, your huddled masses yearning to breathe free” – a welcome to the tens of millions of immigrants fleeing European poverty for the United States in the 19th and early 20th century. SPARC researcher, Dylan Connor, asks whether Irish emigrants were, in fact, Europe’s tired and poor, and examines the factors associated with their economic attainment in the United States. By analyzing hundreds of thousands of historical census records, he found that while the children of poorer farmers and illiterate men were more likely to leave Ireland, their humble origins did not appear to hinder their American-born children. Connor also determined that their economic success was heavily determined by where they settled in the United States. In a compelling story – relevant to conversations regarding immigration today – his research validates that many immigrants fared well and made great contributions to the US economy, despite their modest backgrounds.
Historical Urban Development
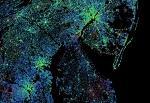
In the United States, nearly 81% of the population lives in an urban area. The pace of urbanization has rapidly increased throughout the past 200 years, yet we still need to gain a clearer view of how cities have developed in the past. Using over 200 million property records provided by Zillow, Dr. Dylan Connor and his team produced a high-resolution analysis showing the evolution of US cities from 1810-2015. Distinct patterns emerged through their analysis, such as densification and diffusion across regions, which are linked to broader development trends. Access to this new dataset and the application of their innovative methods provide a unique opportunity to study long-term urbanization patterns from a land-based perspective. Dr. Connor and his team have made these data publicly available through the Historical Settlement Data Compilation. Understanding the complex development of urban areas has always been challenging, but aided by extensive meta-analysis, this research will help us better understand urban development with the potential to design more equitable and sustainable cities.
Mapping the Health of Communities
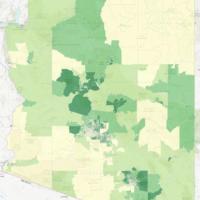
The Arizona Healthy Community Map is a joint effort of Arizona State University’s School of Geographical Sciences and Urban Planning, SPARC researchers and Vitalyst Health Foundation to develop a statewide, publicly accessible interactive map and database of social and environmental conditions related to neighborhood health in Arizona. The purpose of the map is to promote awareness and provide information about health opportunities and disparities among diverse communities within the state.
Deforestation
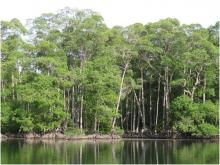
The latest research from SPARC has revealed the true cost of deforestation – which could lead to billions of dollars of lost revenue when mangrove forests are depleted or converted in favor of other forms of land-use. Prior to this research very little data existed to help us understand the monetary value of the ecosystem services provided by this special type of forest, which only grows in the salty water along tropical and sub-tropical coastlines. Using advanced remote sensing technology and innovative analysis techniques, SPARC has provided a new analysis of the costs and benefits of mangrove forests versus other land-use options, which has potential to influence important decisions about future land-use development that will impact humans and ecosystems.
Improving Storm Warnings Using Drones
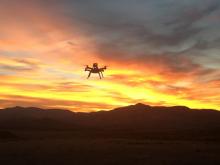
When you’re in the path of a tornado, every minute's notice to seek shelter counts. High speed winds require high speed action, and the researchers at SPARC are racing into the storm by developing new technology and sensors that could warn that a tornado is forming up to an hour before it hits. By using unmanned aircraft systems, also known as “drones”, Amy Frazier’s team, along with colleagues from four other universities, are capturing data from the lower levels of the atmosphere to better understand how severe storms form. New data combined with innovative forecasting models will be a game changer – the team aims to increase the current warning time of 13 minutes to nearly an hour, saving countless lives by giving people more time to prepare and take shelter from the storm.
Geographic Impact on Voting
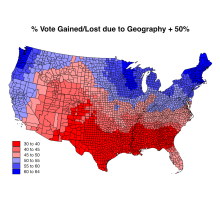
In the increasingly partisan climate regarding voting behavior in the United States, have you ever wondered what causes some people to vote Democrat and others to vote Republican? SPARC research director, Stewart Fotheringham, has analyzed voting patterns from the 2016 Presidential election with a revolutionary new statistical technique he developed called the Multiscale Geographically Weighted Regression (MGWR), which is able to assess how factors such as an individual’s age, gender, ethnicity and level of education relate to voting preference across the country. The most remarkable aspect of the MGWR technique is its ability to identify and quantify the contribution of place in determining voting behavior – it clearly shows how where you live affects how you will vote. In some instances location has considerable influence on whether a person will vote Democrat or Republican, and in the case of the 2016 Presidential election, his model predicted the outcome with incredible accuracy.
Local Modeling with Geographically Weighted Regression
A great deal of interest is currently being shown in local models of spatial processes – models of processes which might vary over space as opposed to being constant over space as is traditional assumed. A popular model for examining possible spatial non-stationarity of processes is Geographically Weighted Regression (GWR). As one of the originators of this technique, Stewart Fotheringham is continuing research into this topic focusing currently on the development of multiscale GWR, inference for GWR and on developing robust software for multiscale GWR.
A current version of the GWR software and some sample data sets are available for download on the SPARC Resources portion of our webpage.
Turbulent Skies
Anyone who has ever flown in an airplane might be familiar with the term turbulence, but this natural flow and movement of air isn’t limited to controlled airspace zones. Turbulence occurs in many forms – imagine swirls of smoke from an extinguished birthday candle or waves in the ocean. The concept of turbulence still presents many mysteries to modern science and researchers from ASU’s SPARC team in collaboration with Oklahoma State University are addressing this physics problem from a geographical perspective. They are collecting data using drones that will reveal the links between space and various meteorological measurements, such as temperature, humidity, and wind velocity and the patterns of turbulence within an area. Drones can fly to heights that weather towers can’t reach, and these highly specialized models are fitted with sensors for collecting atmospheric data that will help the researchers visualize how turbulence looks and behaves. This research could lead to advances in many fields, as well as contributing to a better understanding of how turbulent movement initially starts and how it moves heat and pollutants through space.
Arizona Mental Health and Substance Abuse App
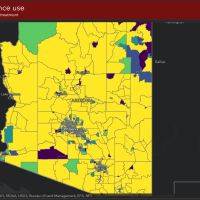
The Arizona Health Care Cost Containment System (AHCCCS), in collaboration with Arizona State University (ASU), launched a project to address the medication for opioid use disorder (MOUD) treatment disparities for Pregnant and Parenting Women (PPW) with Opioid Use Disorder (OUD). This initiative focused on developing a comprehensive mapping system to capture and illustrate a wide range of clinical, geographical, and demographic data, offering a detailed view of treatment availability and needs across Arizona. We created a unique composite risk score to measure the community-level risk for future opioid overdoses.